
The S&P 500 index reached an all-time highs of 7,798 in August as the largest companies reported both record earnings and accelerating sales growth (Nvidia, the largest stock in the index, saw its quarterly sales growth accelerate from 80% to 100% year over year). This was driven by increased investment in AI infrastructure as well as growth in the cloud computing businesses of companies such as Alphabet and Microsoft. According to UBS, 27% of Alphabet’s $100billion annual cloud business is now coming from Anthropic and OpenAI.
The conflict in Iran continued to support energy shares over the quarter. While regional crude oil exports are now close to pre-war averages (17million+ barrels a day), refined product shipments (such as diesel, jet fuel and Naptha), are estimated by CNN to be at around half of pre-war averages. This has contributed to the higher price of diesel, benefiting refiners such as Valero (+56% over the quarter) but hurting US consumers, who remain almost 70% of the US economy. A CBS News analysis from early September estimated that US consumers have absorbed $100billion in additional costs from rising fuel prices, split between higher gasoline prices ($55billion) and higher diesel prices ($45billion). Over the last quarter, consumer-facing companies such as Walmart and McDonalds reported that these increased costs are causing customers to reduce their spending. The below chart shows how the growth of energy shares over the quarter was partly at the expense of shares in the Consumer Discretionary and Consumer Staples sectors. A reversal in oil prices should help to reverse this trend.

Source: Bloomberg / formatting with Claude
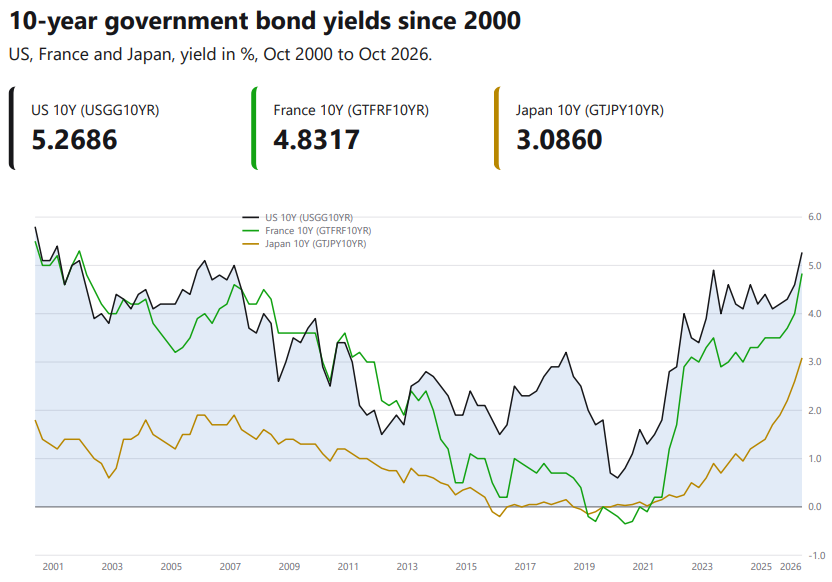
Both equity and bond investors would have been aware of the climb in the US 10-year yield (in addition to the first rate hike since 2023) to levels not seen since the beginning of the century. The rising interest rate environment is global; Japanese 10-year government bonds have reached 30-year highs of 3%, while French borrowing costs are almost catching up with US levels. Rising rates means that borrowers everywhere have to offer higher rates in order to secure loans. Japanese investors, who according to congress.gov are the largest non-US holders of US government debt, may end up reducing their holdings of US Treasuries in favour of local bonds given the improved yields on offer. According to Reuters, Japan’s government has already asked its pension funds to consider it.
Source: Bloomberg / formatting with Claude
Ed Yardeni believes that rising government bond yields should be treated as a “normalization” of borrowing costs after central banks artificially pushed rates lower post GFC. Investors now have improved opportunities in fixed income, which will mean that dividend investors, for example, will require higher yields. Despite the better opportunities on offer in fixed income, the long-term differential between bonds and equities remain compelling: an initial investment of USD$1 in equities in 1900 grew to $124,834 in nominal terms by 2025, according to UBS. Over the same period, long-term bonds grew to only $284 while treasury bills increased only to $69. Despite the long-term outperformance, informed investors are often concerned about investing at the “highs”, particularly when there are high interest rates on offer. A “Coffee can” approach might help in this case, and the next section will look at “Coffee can” investing over the long term.
“Coffee can” investing and looking at one “coffee can” portfolio 32 years on:
In the Fall 1984 issue of the Journal of Portfolio Management, Robert Kirby, an investment advisor, wrote about the notion of a “coffee can portfolio”. Kirby felt that too many investment advisors started off as investors but ended up as “traders”, due to the short-term nature and fast moving pace of the investment world. It is fair to say that the investment world is even faster today. In the “Old West”, Kirby wrote that people would “put their valuable possessions in a coffee can and kept it under the mattress”. Kirby felt that this type of approach might be helpful in selecting a portfolio.
The benefits of this strategy was “brought home” to him as a result of an experience with a client in the 1950s. The client’s husband, a lawyer, handled her financial affairs and was the primary contact. Kirby had worked with the client for about ten years when her husband suddenly died. The client inherited her husband’s estate and called to say that she would be adding his securities to the portfolio under management. When Kirby received the list of assets, he was amused to find that the husband had been secretly “piggy-backing” the firm’s recommendations. Then, when Kirby looked at the total value of the estate, he was “shocked”. The husband had applied “a small twist of his own” to the recommendations. He ignored the sale recommendations- simply putting about $5,000 in every purchase recommendation. Then he would “toss the certificate in his safe-deposit box and forget about it”. Kirby remarked that the portfolio was “odd-looking”, owning a number of small holdings with values of less than $2,000, and several large holdings in excess of $100,000. There was also one “jumbo holding worth over $800,000 that exceeded the total value of his wife’s portfolio and came from a small commitment in a company called Haloid; this later turned out to be a zillion shares of Xerox”.
Kirby coined this strategy “active passive”. An “active” decision is made at the start, and then investors remain “passive” once the share is bought. In a sense, this is at odds with the standard investment framework (and what Kirby was doing for his clients): “As your most successful investments grow in value, you make partial sales and transfer the capital involved to your less successful investments that have gotten cheaper”. There is little long-term data on how “coffee can portfolios” perform over the long term, but as an example, we can look at a “coffee can portfolio” chosen from the S&P 500 in January 1994.
Investing $300,000 in the index alone in January 1994, and not reinvesting the dividends, would have returned $5,000,000 today. Reinvesting the dividends (in a structure where no withholding taxes are applied) would have grown the portfolio to over $9million. A complimentary strategy to this would have been to hold a subset of 30 individual shares in equal amounts of $10,000.
Selecting a sub-group of 30 shares from the 500 stocks in the S&P 500, would have given investors a 6% chance of including Apple in their portfolio. A $10,000 investment in Apple in January 1994 would be worth just short of $13,000,000 today (not reinvesting the dividends). Apple is the standout performer, but there were at least 10 shares where a $10,000 investment would have, on their own, reached more than $700,000 (the list is below).
| Company | Current Price (BDP) | Maximum Drawdown | Other Notable Drawdown Periods | Bloomerang Analyst Rating (5 = Srong Buy, 1 = Srong Sell) | Price Return from 1 Jan ’94 | Total Return from 1 Jan ’94 |
|---|---|---|---|---|---|---|
| Apple Inc | 333.69 | -82% | March 2003 -82% | 3.93 | 127,652.7% | 156,350.5% |
| TJX Cos Inc/The | 132.68 | -61% | March 1995 -60% | 4.53 | 14,477.0% | 21,895.5% |
| Oracle Corp | 142.30 | -84% | September 2026 -65% | 4.56 | 9,922.5% | 12,521.7% |
| Costco Wholesale Corp | 920.65 | -54% | December 1994 -38% | 4.20 | 9,465.2% | 14,277.9% |
| Parker-Hannifin Corp | 972.55 | -67% | August 1998 -42% | 4.44 | 8,595.0% | 14,816.9% |
| ITT Inc | 206.17 | -55% | April 2020 -40% | 4.86 | 7,811.7% | 12,147.5% |
| SPX Technologies Inc | 173.09 | -81% | December 2015 -70% | 4.85 | 7,644.9% | 9,974.1% |
| Eli Lilly & Co | 1,142.85 | -68% | December 2010 -55% | 4.66 | 7,599.1% | 17,785.6% |
| Caterpillar Inc | 845.42 | -74% | January 2016 -39% | 4.21 | 7,499.3% | 16,467.5% |
| Texas Instruments Inc | 293.80 | -81% | February 2005 -74% | 3.82 | 7,302.7% | 12,810.6% |
Source: Bloomberg
Selecting 30 stocks from the list of 500 would have given investors a 50/50 chance approximately of holding one of the ten “super performers” above. One of the challenges of holding the above shares is that investors would have had to suffer through multiple periods of dramatic price declines. The “lucky” Apple investor would have had to sit through a peak to trough decline of 80% in the stock around March 2003. Notably, some of the largest drawdowns occur outside of the traditional “great crashes”- Caterpillar declined by 39% from its peak in January 2016, while Texas Instruments was down -75% from its peak by February 2005. Right now, Oracle investors in January 1994 would be happy knowing that their $10,000 investment is now worth $1.4million today, but it was as high as $3m in September last year. SPX Technologies, ticker SPXC (not to be confused with SpaceX/ ticker SPCX), annualized at 15% a year, for 7,600% in total, and did not contribute at all to the returns of the S&P 500 index, despite starting in the index and being one the best performers over the period. This is because, instead of turning into a large-cap firm, the company has strategically broken itself apart multiple times over the decades. Coffee can investors would have needed to have actively sold the spinoffs and reinvested into the parent company to ensure those long term returns.
In addition to the above ten names, there are 57 further names that outperformed the price value of the S&P 500 index since 1994 and have remained largely unchanged. Of these shares, the below are down at least 20% from their all-time highs. The current Bloomberg average Analyst rating is also included- with a rating of 5 being a strong buy, and a lower score registering less conviction from the analyst community. A rating of less than 4 would mean that many analysts have a sell or a neutral on the stock.
| Company | Price 1 Jan 1994 (split-adj.) | Current Price | Decline from All-Time High | Analyst Rating (5 = Srong Buy) | Price Return since 1 Jan ’94 | Total Return since 1 Jan ’94 |
|---|---|---|---|---|---|---|
| Oracle Corp | 1.42 | 142.30 | -56% | 4.56 | 9,923% | 12,522% |
| NIKE Inc | 1.45 | 33.87 | -53% | 3.21 | 2,243.5% | 3,492.7% |
| Corning Inc | 7.89 | 164.19 | -40% | 4.45 | 1,994.3% | 3,502.8% |
| Lowe’s Cos Inc | 3.72 | 180.80 | -38% | 4.14 | 4,761.8% | 7,141.7% |
| Northrop Grumman Corp | 16.95 | 478.00 | -38% | 4.13 | 2,719.6% | 5,586.1% |
| L3Harris Tech Inc (Former Harris) | 9.22 | 236.60 | -38% | 4.14 | 2,466.1% | 4,617.7% |
| Autodesk Inc | 5.63 | 212.00 | -35% | 4.72 | 3,668.9% | 3,984.3% |
| SPX Tech Inc | 2.23 | 173.09 | -31% | 4.85 | 7,645% | 9,974% |
| Home Depot Inc | 8.78 | 282.85 | -29% | 4.02 | 3,122.3% | 5,666.5% |
| Cummings Inc | 13.44 | 528.32 | -28% | 4.30 | 3,831.5% | 8,180.1% |
| S&P Global Inc (Former McGraw-Hill) | 8.00 | 386.27 | -26% | 4.71 | 3,831.5% | 8,772.6% |
| Kroger Co | 2.52 | 59.03 | -23% | 3.88 | 3,831.5% | 3,287.9% |
| Walmart Inc | 4.17 | 104.26 | -23% | 4.69 | 2,402.2% | 4,007.8% |
| TJX Cos Inc | 0.91 | 132.68 | -22% | 4.52 | 14,477% | 21,896% |
| American Express Co | 7.89 | 302.78 | -22% | 4.00 | 3,736.9% | 6,020.4% |
| Caterpillar Inc | 11.13 | 845.42 | -21% | 4.21 | 7,499% | 16,467% |
| PACCAR Inc | 3.51 | 109.68 | -21% | 3.90 | 3,027.5% | 10,558.8% |
| Dover Corp | 10.17 | 189.69 | -20% | 4.58 | 1,765.3% | 3,164.9% |
| PulteGroup Inc | 4.53 | 115.73 | -20% | 3.89 | 2,454% | 3,228.2% |
| XPO CNW Inc (Former Consolidated Freightways) | 9.60 | 186.09 | -20% | 4.52 | 1,839.3% | 1,839.3% |
| S&P 500 Index | -0.32% | 1,839.3% | 2,940.87% |
Prices are split-adjusted. Analyst rating: 5 = Strong Buy, 1 = Strong Sell (Bloomberg consensus).
Source: Bloomberg
If “only” 171 shares of the original 500 in the S&P 500 in January 1994 are publicly traded today, what happened to the majority of the shares? While 40 went bankrupt and 30 were taken private, 254 were acquired (either for shares or for cash). Being acquired could be great news for “Coffee Can” shareholders. A great example of this was JPMorgan. Six companies that formed part of the S&P 500 in January 1994 ended up being part of today’s JPMorgan: Chemical Bank (which merged with Chase Manhattan and then acquired JPMorgan, taking the name), First Chicago Corp, NBD, Chase Manhattan, Bank One and JPMorgan. Ironically, on a price return basis, JPMorgan’s original shareholders had the lowest price return, but shareholders of all companies would have done better than the index once reinvested dividends were taken into account, and very well without reinvesting the dividends.
| Company | Acquisition Detail | Date (acquired / 1 Jan 1994) |
Price Return from January 1994 |
Total Return from 1 Jan ’94 |
|---|---|---|---|---|
| JPMorgan Chase & Co | Originally – these were shares of Chemical Bank | 01-Jan-1994 | 2,385.1% | 6,219.6% |
| First Chicago Corp | First Chicago NBD -> Bank One -> JPMorgan Chase | 01-Jan-1994 | 2,385.1% | 5,320.5% |
| Index Return from Jan 1994 | 1,555.64% | 2,940.87% | ||
| Chase Manhattan Corp | Merged with Chemical Bank (kept Chase name) | 31-Mar-1996 | 1,848.1% | 4,786.7% |
| First Chicago NBD Corp | Banc One -> Bank One -> JPMorgan Chase (2004) | 31-Mar-1996 | 1,745.8% | 4,310.6% |
| Bank One Corp | JPMorgan Chase | 31-Mar-1996 | 1,396.4% | 2,991.2% |
| JP Morgan & Co Inc | The Original JPMorgan | 31-Mar-1996 | 1,217.4% | 3,190.6% |
Source: Bloomberg
Today, 44% of the S&P’s individual components are at least 20% below their 52-week highs. This could thus be a great time for “coffee can” investors. One thought remains – is it “better” overall to buy the whole basket of 500 shares rather than actively selecting 30? It is difficult to know how even a random allocation of 30 shares in January 1994 would have done, primarily because the vast majority of shares are acquired along the way. Kirby noted in his original article that the “magic” of the S&P 500 index’s returns are usually made prominent after a period of strong returns – we would argue that a “coffee can” strategy can compliment an investor’s holdings in the index – and there is never a bad time to start. It is one of the great ironies that Warren Buffett has advocated investing in the S&P 500 index since at least 1993, but Berkshire Hathaway, the company he co-founded, was not eligible for inclusion in that index until 2010. Before then, it might have been a good candidate for the “coffee can”.

Forrest Gump, a famous (fictional) coffee can investor. In the 1994 film, Gump is convinced to invest in “some kind of fruit company (Apple)” in 1975. He quickly forgets about the investment and is later told that he “never has to worry about money again”. (His response – “one less thing”). An investor who had copied Gump and bought $10,000 of Apple shares on the 1st January the year the film came out would have shares worth just under $13 million today (in addition to the dividends earned along the way).