“Magnificent Seven” lead S&P 500 recovery
Markets continued their recovery from 2022; the Nasdaq 100 index of shares is now up 39% for the year following a 32% decline last year, while the S&P 500 index is up 17% for the year (-19% in 2022). Much of the stock market growth this year has been concentrated in a small number of shares, including Apple (+47%), Microsoft (+42%), Nvidia (+189%), Meta (+136%), Alphabet (+35%), Amazon (+53%) and Tesla (+112%). Indices which had more exposure to sectors outside of technology, such as the Dow Jones and the S&P 600 (US smaller companies), were each up only 5% to the end of June.
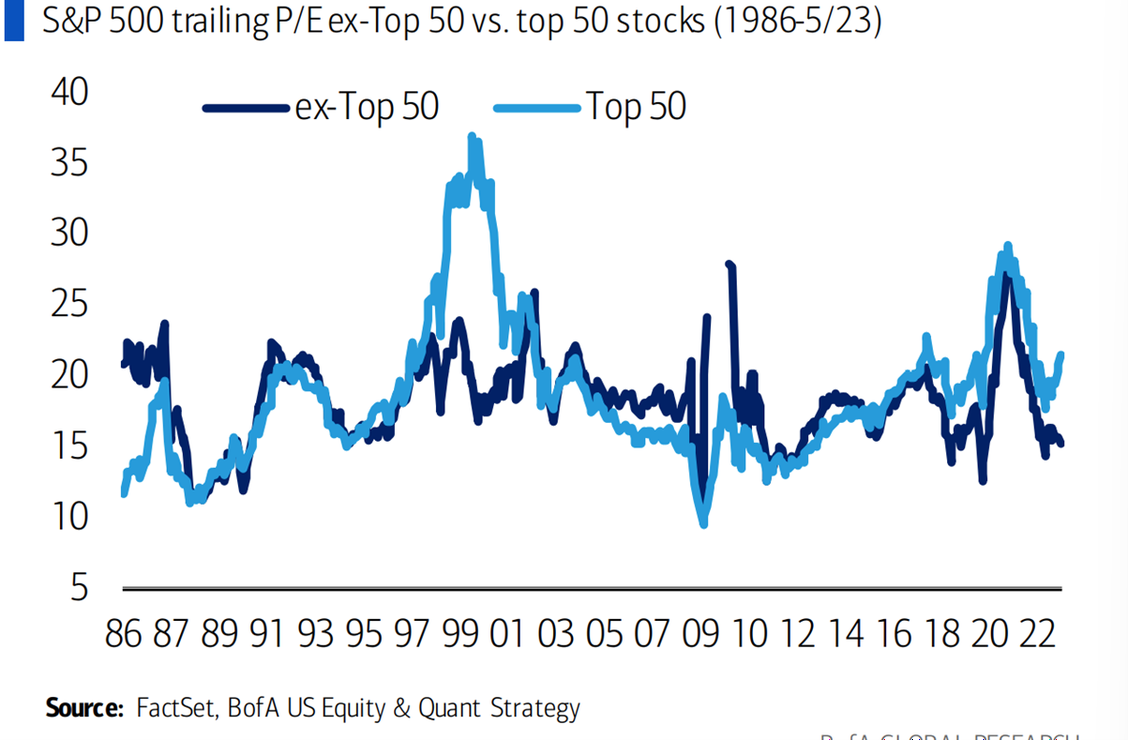
A possible reason for the divergence between the returns of the Nasdaq and the Dow is that investors are forecasting a protracted decline in earnings in many companies that are more sensitive to the business cycle, such as those in energy, industrials and financials. Many of this year’s stars, such as Meta, Alphabet and Nvidia, witnessed earnings declines in 2022. These companies are now seeing a return to earnings growth. There is perhaps also the view that interest rates will start to decline later in the year as the US economy falters. In this scenario, those shares exhibiting strong, “recession-proof” earnings or exposure to a multi-year theme will command a premium while more economically-sensitive shares will lag. This view has created a divergence in valuation – according to research by Bank of America, excluding the top 50 stocks, the S&P 500 trades at just 15x its earnings for the last 12 months.
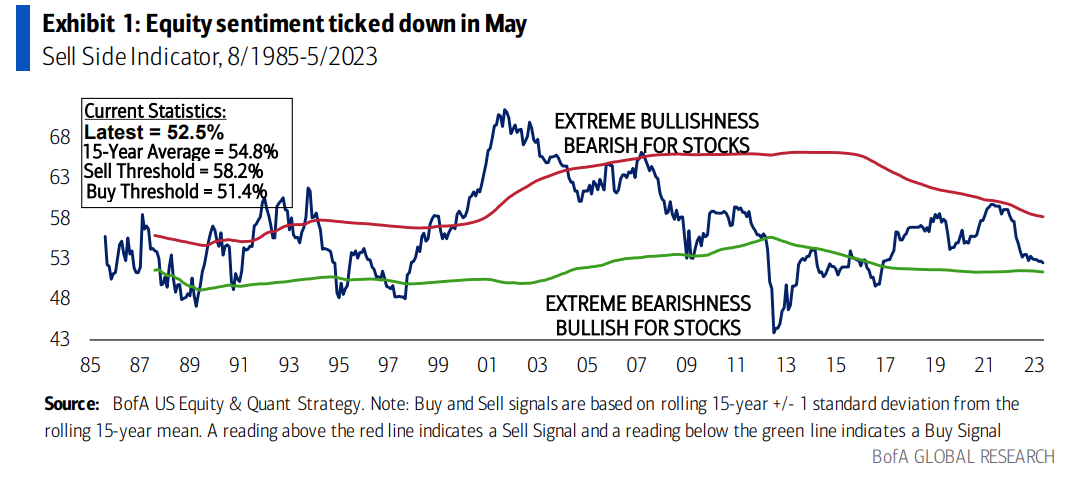
Despite the strong returns so far this year, investors remain pessimistic– Bank of America’s Sell Side Indicator (based on investor sentiment) is just 1% away from triggering a “Buy” signal – the closest it has been in almost six years. Investor pessimism tends to be a “contrary indicator”- this means that markets start to do well when investors are very bearish (“no more sellers”) and markets run out of steam when a large percentage of investors are bullish (“no more buyers”).
Although the rapid rise in interest rates will certainly create adjustments for both consumers and companies, we prefer shares over cash. Businesses have historically shown the ability to grow earnings above inflation. Interest rates and the economic cycle are much harder to predict.
The Dow Jones and the Business Cycle
It is notoriously difficult to anticipate stock market returns by looking at the business cycle. The stock market tends to decline prior to recessions and rise before economic recoveries. The tricky part is that recessions and recoveries are often confirmed only many months after they have ended.
The returns during the 12 post-war recessions are summarized below. You can see that the stock return index peaked anywhere between 0 to 13 months before the beginning of the recession. The stock market gave no advance warning of a downturn for the recessions that began in January 1980 and July 1990, and the Covid-19 recession in February 2020. Although we have not had confirmation that the business cycle peaked last year, it is interesting to note that the maximum 12-month decline last year of 21% was close to the average maximum 12 month decline around the peak of the business cycle.
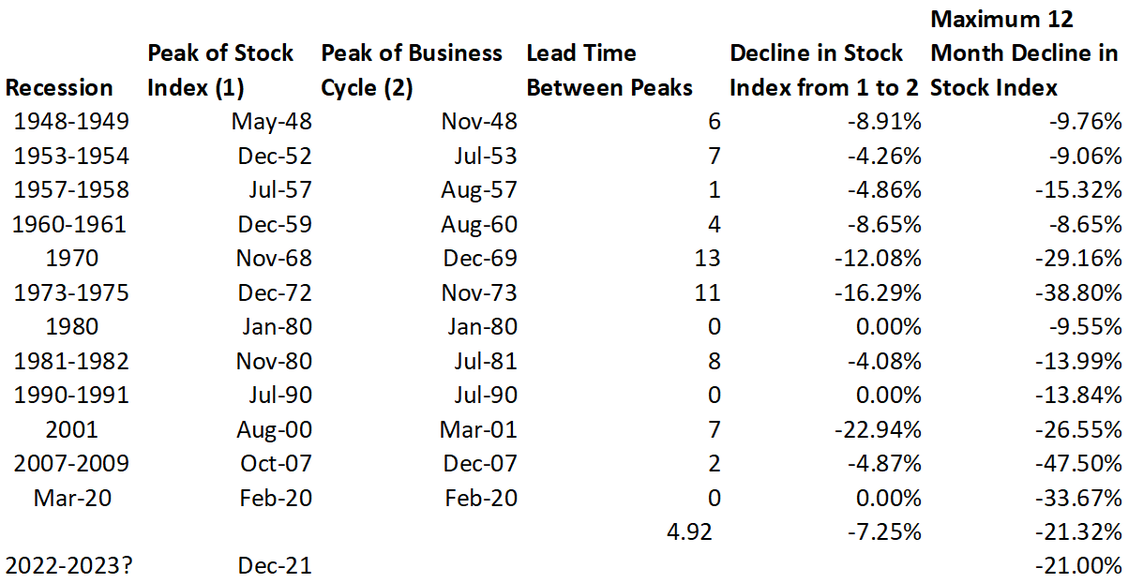
Source: Siegel, KDT. Stock Index is Dow Jones Industrial Average
It is possible that last year’s 21% decline was a “false alarm” and there will be no recession in 2023. There have been 15 cases since 1945 where a decline of more than 10% in the Dow Jones Industrial Average was not followed by a recession in the next 12 months. The most recent false alarm was October 3rd 2018 to December 24th 2018, where markets declined by -19.4%, but no recession followed in the next 12 months.
The trough in the stock return index and the trough in the business cycle are compared below. The average lead time between the bottom of the market and the bottom of an economic recovery has been 4.3 months. We have not yet had any confirmation on a recession, as it can take months for the National Bureau of Economic Research or NBER to decide on whether a recession has taken place. Nevertheless, it is noteworthy that the recovery of 20% almost matches the average recovery in the index between the trough of the stock index and the Trough of a business cycle.
In 2018 the IMF released a working paper, “How Well do Economists Forecast Recessions?” The main finding was that, “while forecasters are generally aware that recession years will be different from other years, they miss the magnitude of the recession by a wide margin until the year is almost over… Strong booms are also missed, providing evidence for (the) view that behavioural factors – the reluctance to absorb either good or bad news – plays a role in…forecasts”.
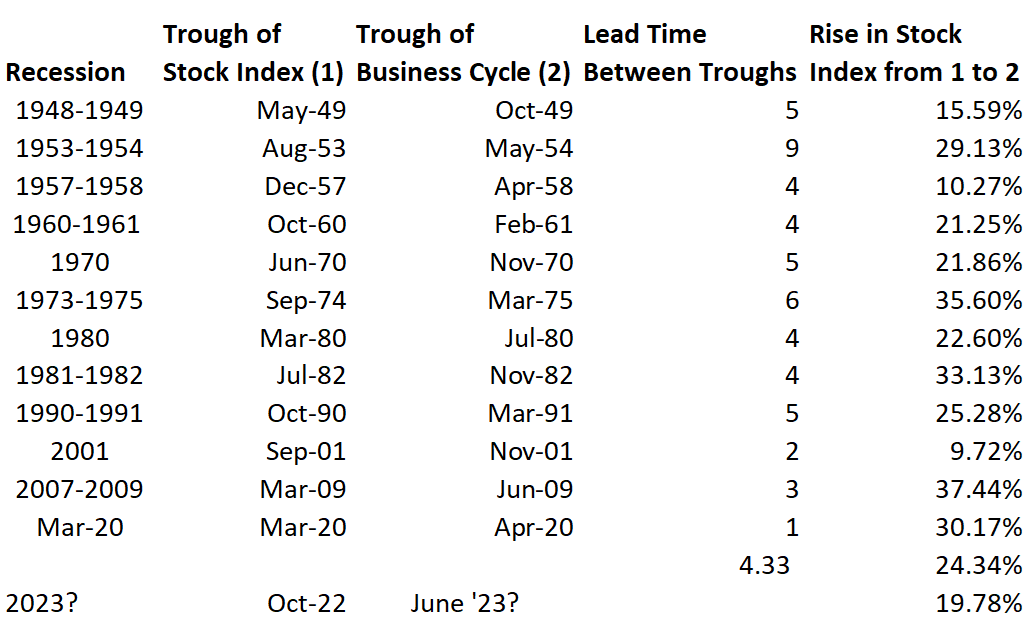
Source: Siegel, KDT. Stock Index is Dow Jones Industrial Average
Earnings Volatility
The below table looks at the change in earnings for 25 large companies across ten sectors on a calendar year basis from 2019 to 2024. These changes are then compared to the Federal Reserve’s preferred unit of inflation, “core” PCE or Personal Consumption Expenditures outside food and energy. When the earnings change was less than the increase in “core” PCE, the year is highlighted.
In the group, many of the companies have had at least one year where their earnings declined or grew less than inflation. For example, 2022 witnessed earnings declines for many technology-oriented companies, while 2023 looks to be a year of earnings declines for Energy shares, Financials shares and Industrials.
Despite many of the companies struggling to stay ahead of inflation in individual years, on average, 2023’s median earnings for the group will be 45% higher than in 2019. If earnings expectations are met, only four shares out of the 25 will have grown their earnings less than the increase in the PCE index over the period.
The below table hopefully serves to illustrate how diversifying investments across sectors can give protection to portfolios, as many businesses’ earnings are affected differently by the business cycle and may even continue to grow as the global economy contracts. You can also see that those companies which did not experience an inflation-adjusted calendar year decline this year have been rewarded with generally higher market multiples (share price divided by anticipated earnings for 2023).
US Large Company Earnings 2019-2024
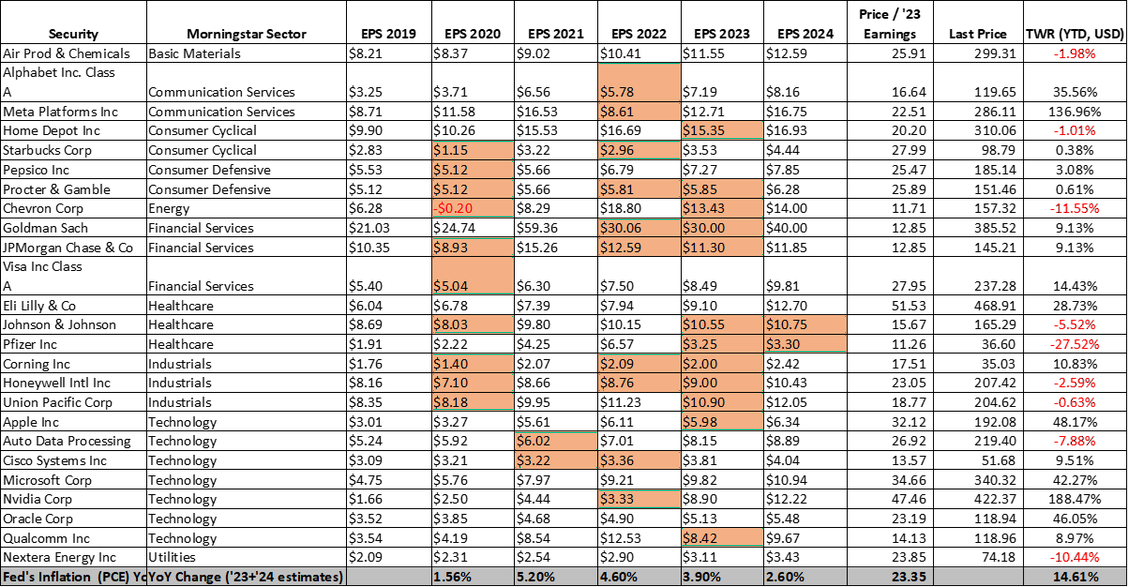
Source: KDT, BAML, UBS. Years where earnings’ change are below change in PCE are highlighted
Extract from Jeremy Siegel’s Stocks for the Long Run – Standard Oil of New Jersey and IBM
“Imagine that you are transported back to the beginning of 1950 and a recently deceased uncle has just bequeathed $10,000 to your newborn daughter. The bequest has specific strings attached: With this money, you must buy either Standard Oil of New Jersey (now ExxonMobil) or a much smaller, but promising new-economy company called IBM. You are also instructed to reinvest all dividends back into the stock you choose and to put your investment under lock and key, only to be opened when your daughter reaches the age of 60 in 2010.
Which Firm should you buy?
To aid your decision, let us assume a genie appears and tells you the actual annual revenue, earnings, dividend growth rates of each of the two firms over the next six decades, and the change in the market capitalization of the technology and energy sectors. Furthermore, the genie tells you that IBM will develop the first commercial computer in two years and will dominate technology over the next two decades like no other firm has before or since. None of IBM’s fabulous growth was anticipated in 1950. The data on earnings, dividends and revenue growth over this 60-year period is below:
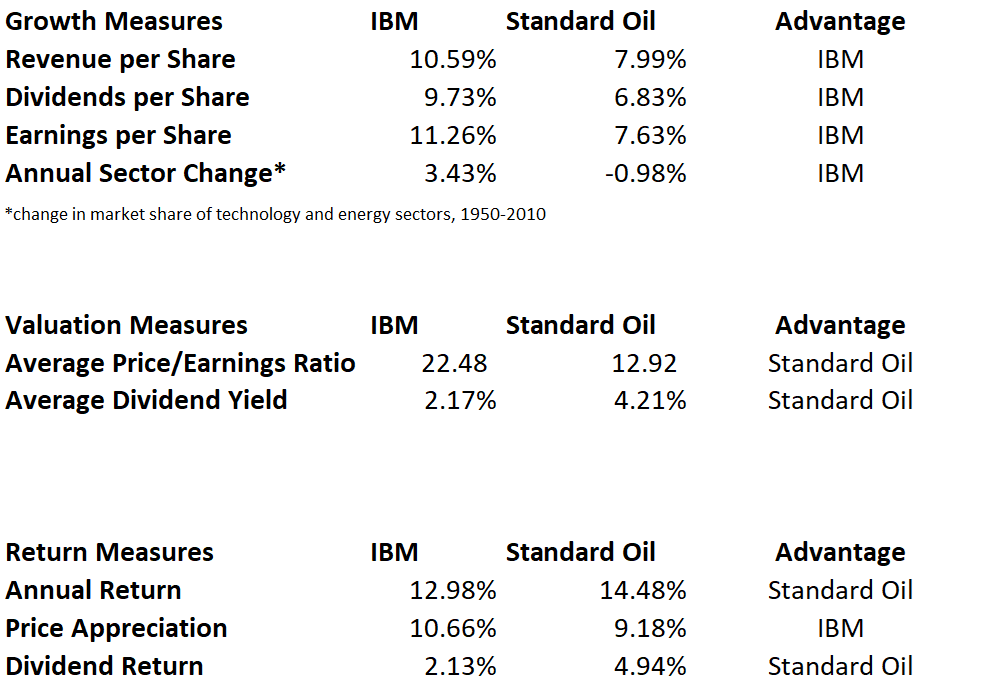
Source: Jeremy Siegel, “Stocks for the Long Run” Sixth Edition
You can see that IBM beat Standard Oil by wide margins in every growth measure that Wall Street professionals use to choose stocks. IBM’s earnings per share growth, the Street’s favourite stock-picking criterion, surpassed the oil giant’s growth by more than 3 percentage points per year over the next six decades. Furthermore, the oil industry’s share of the market shrunk dramatically over this period. Oil stocks comprised about 20 percent of the market value of all US stocks in 1950, but fell to nearly half that value in 2010 while the share of the technology sector increased more than sixfold.
With all this information, you confidently choose IBM shares. The decision looks like a slam dunk.
But IBM turned out to be the wrong choice. In 2010, when the lock-box is opened, your daughter would probably be pleased to see almost $15 million worth of IBM stock, but had you purchased Standard Oil instead, the investment in the oil giant would be worth more than $33 million. By the way, both IBM and Standard Oil beat the market over that time period, as an investment in a capitalization-weighted index fund would have accumulated only $5 million.
Why did Standard Oil beat IBM when it fell far short in every growth category? Certainly, right after 1950, IBM surged ahead of Standard Oil. The excitement caused by IBM’s new products caused IBM’s valuation to rise markedly, and although it continued to churn out superior growth, the average price investors paid for IBM shares during those six decades was just too high. The average P/E ratio of Standard Oil was about half of IBM’s ratio, and the oil company’s average dividend yield was almost 3 percentage points higher. Because Standard Oil’s price was lower and its dividend yield much higher than IBM, those who bought its stock and reinvested the oil company’s dividends would have accumulated to 11.87 times the number of shares they started out with, while investors in IBM accumulated only 3.6 times their original shares. Although the price of Standard Oil’s stock appreciated at a rate that was almost 2 percentage points below that of IBM, its higher dividend yield made the oil giant the winner for long-term investors.”
KDT Comment: The above extract is a great example of how important valuation is in the long run. I would add that dividend payout ratios are today much lower than before (at around 31% today vs 64% in 1960). Nevertheless, today many companies utilize share buybacks – and there will be significantly more value creation when buying back shares at, for example, 13 times earnings versus buying back shares at 22 times earnings. As Warren Buffett mentioned in the 2023 Berkshire Hathaway Annual Shareholder meeting, (buying back shares) “can be the dumbest thing you can do or the smartest thing you can do”.

